wavelets
Wavelets are used to separate (or decompose) an image into a number of distinct layers, each containing a different level of detail. After decomposing an image in this way, a module can limit its processing to one or more of these detail layers, and then piece the layers back together again at the end to form its output. This allows us to be surgical about which features in the image we wish to impact when working with a module.
Some of the operations that darktable can perform in this way are:
- noise removal (in the denoise (profiled), raw denoise and contrast equalizer modules)
- contrast adjustment (in the contrast equalizer module)
- blurring or removal of unwanted detail (in the retouch module)
🔗theory
A wavelet is an oscillating mathematical function that starts and ends at zero. The following diagram shows some simple wavelets of differing sizes.
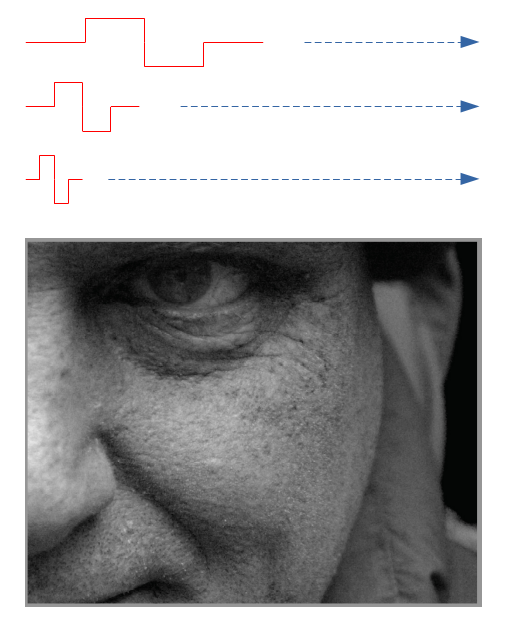
These wavelet functions are used to scan and decompose an image using a mathematical operation called convolution. This picks out details from the image that are on a similar scale to the size of a given wavelet, and builds a number of these detail layers, each corresponding to a different wavelet scale.
The following is an example where detail layers have been extracted from the above image. In this case, the images were produced using the retouch module, splitting the image into 8 different layers, and using the module’s “display wavelet scale” button to visualise each of the detail layers:
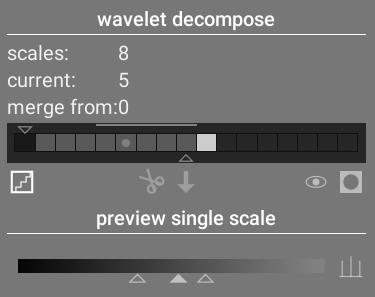
The bars in the wavelet decompose section indicate the layers that have been extracted at different wavelet scales. The darkest rectangle at the left represents the entire image (before decomposition) and the gray boxes each represent one of the decomposed layers. Clicking on the staircase icon below the bar graph enables the layer visualization overlay so that you can see what the currently selected layer looks like.
Let’s take a look at some of the layers generated for the above image.
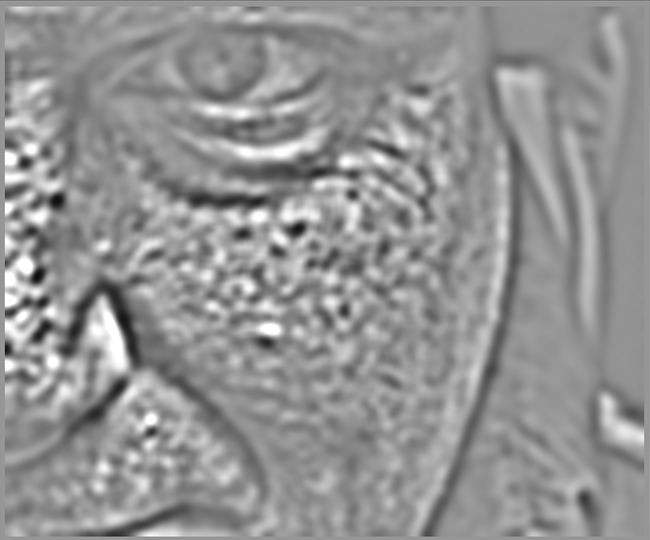
At scale #2, the image contains only very fine details, including the model’s eyebrows, eye lashes and the pores of his skin. It doesn’t include the coarser details of the image, because those details have been extracted to other layers:

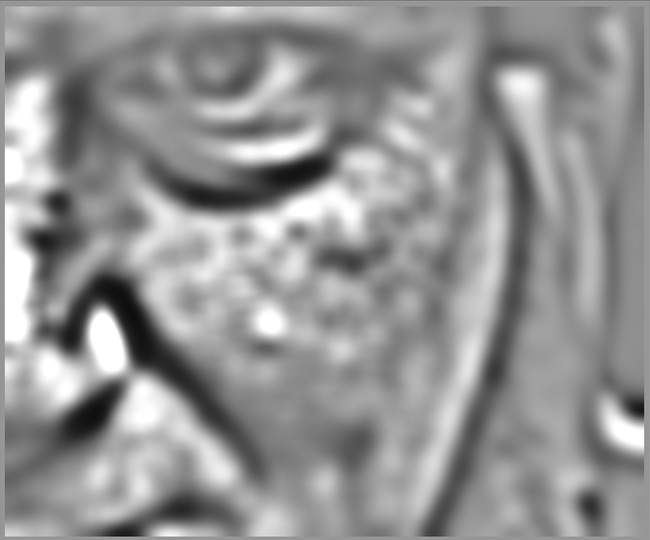
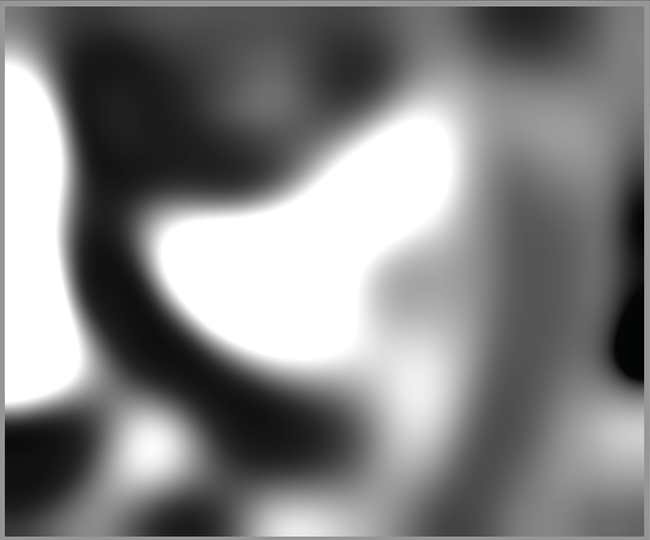
At scales #5 and #6 we begin to see larger and larger features:
By scale #8 we only see very high-level features such as the overall shape of the model’s nose, eye and cheek:
🔗why use wavelets?
Suppose, in the above example, that we wanted to smooth out some of the blotchiness in the model’s skin, without losing any of the underlying small-scale texture. Wavelet decomposition makes this a trivial operation - we can simply use the retouch module to apply a Gaussian blur to only the ‘blotchy’ detail layer(s), leaving all other layers untouched. Once the adjustment is complete, the retouch module simply recombines the adjusted layer with the remaining untouched layers to produce the final image.
The sequence of images below shows (1) The original image; (2) The layer (scale 5) that we wish to blur; and (3) The final image after the scale 5 layer has been blurred and the layers recombined:
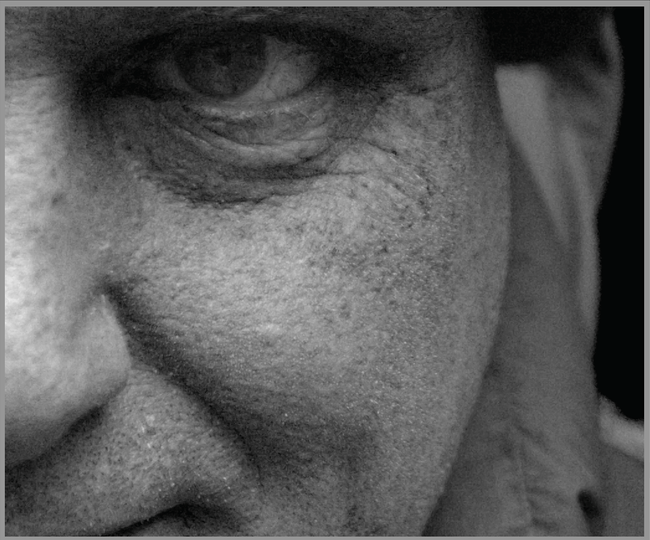
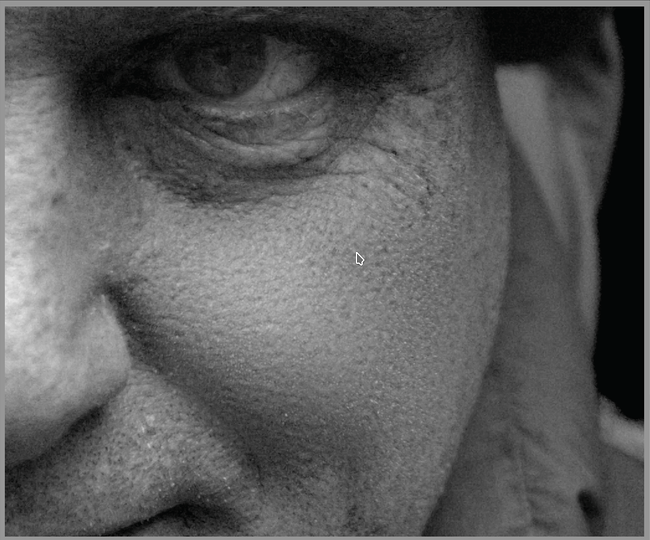
As you can see, the large-scale skin blotches have been removed, but the small-scale details remain untouched.
🔗interacting with wavelet scales
There are two methods by which processing modules allow you to modify their operation using wavelet scales.
🔗wavelet decomposition
As discussed above, the retouch module allows you to choose how many detail levels to split your image into. It decomposes the image into separate layers and allows you to perform operations selectively on each individual layer or on the image as a whole:
See the retouch module documentation for more details.
🔗spline controls
The denoise (profiled), raw denoise and contrast equalizer modules allow their effects to be applied more or less to each wavelet scale using splines.
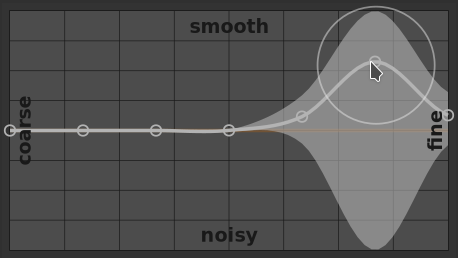
Here, each node in the graph represents a different level of detail in the image, from coarse detail on the left to fine detail on the right. You can raise or lower each of these nodes with your mouse to increase or decrease the module’s effect, respectively, on that wavelet scale.
To modify the curve, click slightly above or below the line near to a node and drag up or down. You can change the width of your modification by scrolling with your mouse wheel, which increases or reduces the size of the circle displayed under your mouse pointer. A small circle indicates that the effect of dragging the curve up or down will be isolated mostly to the node being adjusted. A larger circle indicates that the effect will be more broad and will increasingly impact adjacent nodes. When you hover your mouse over the graph, shaded areas indicate the parts of the spline that will be impacted when you attempt to modify the curve.